Little Paxton (TN) Weather Station
Daily Weather Observations - APRIL 2024
(All Times GMT)
| Date | Max. Temp. (°C) 09/09h | Min. Temp. (°C) 09/09h | Grass Min. Temp. (°C) 21/09h | Earth (30cms) Temp. (°C) 09h | Sun (Hours) 00/00h | R'fall (MM) 09/09h | Wind Dir'n 09h | Mean Wind Speed (MPH) 00/00h | Max. Gust Speed (MPH) 00/00h | Cloud Cover (Oktas) 09h | Mean MSL Air Pressure (mB) 00/00h | Mean Rel. Humd. (%) 00/00h | Mean Temp. (°C) 00/00h | Fog (vis. <1000m @ 09h) | Fog (vis. <200m @ 09h) | Snow or Rain and Snow 00/00h | Snow Lying @ 09h (>50% cover) | Hail 00/00h | Thunder 00/00h | Date |
| 1 | 16.5 | 8.3 | 7.0 | 10.0 | 9.1 | 0.2 | SW | 3.7 | 19 | 1 | 992.8 | 81.9 | 10.8 | 0 | 0 | 0 | 0 | 0 | 0 | 1 |
| 2 | 15.6 | 7.4 | 3.7 | 10.4 | 3.8 | 3.0 | W | 3.5 | 17 | 5 | 1000.1 | 84.9 | 10.7 | 0 | 0 | 0 | 0 | 0 | 0 | 2 |
| 3 | 14.1 | 9.3 | 9.0 | 10.9 | 1.4 | 7.4 | S | 5.7 | 28 | 6 | 998.1 | 86.3 | 11.2 | 0 | 0 | 0 | 0 | 0 | 0 | 3 |
| 4 | 16.1 | 8.6 | 6.3 | 10.9 | 1.6 | 4.4 | SW | 3.8 | 22 | 8 | 1000.8 | 89.6 | 11.5 | 0 | 0 | 0 | 0 | 0 | 0 | 4 |
| 5 | 19.4 | 11.7 | 10.6 | 11.4 | 5.4 | TR | S | 6.9 | 31 | 4 | 1001.4 | 81.3 | 14.4 | 0 | 0 | 0 | 0 | 0 | 0 | 5 |
| 6 | 19.8 | 13.4 | 11.6 | 11.9 | 5.4 | 0.8 | S | 7.3 | 35 | 6 | 999.6 | 73.8 | 16.1 | 0 | 0 | 0 | 0 | 0 | 0 | 6 |
| 7 | 17.0 | 10.3 | 7.9 | 12.0 | 7.7 | 0.0 | S | 8.9 | 40 | 3 | 1005.1 | 71.7 | 13.3 | 0 | 0 | 0 | 0 | 0 | 0 | 7 |
| 8 | 17.0 | 9.1 | 7.1 | 11.8 | 3.6 | 0.9 | S | 4.1 | 19 | 8 | 1002.7 | 82.3 | 12.5 | 0 | 0 | 0 | 0 | 0 | 0 | 8 |
| 9 | 12.4 | 8.4 | 7.0 | 12.0 | 1.5 | 0.1 | W | 7.2 | 34 | 8 | 1005.2 | 82.9 | 8.9 | 0 | 0 | 0 | 0 | 0 | 0 | 9 |
| 10 | 15.7 | 2.0 | -2.5 | 11.2 | 3.6 | 0.1 | S | 5.0 | 26 | 5 | 1023.0 | 87.1 | 9.6 | 0 | 0 | 0 | 0 | 0 | 0 | 10 |
| 11 | 19.8 | 12.8 | 11.8 | 11.5 | 2.8 | 0.0 | SW | 5.0 | 19 | 7 | 1026.5 | 83.7 | 15.7 | 0 | 0 | 0 | 0 | 0 | 0 | 11 |
| 12 | 20.8 | 9.8 | 8.0 | 12.3 | 3.4 | 0.0 | SW | 6.2 | 25 | 8 | 1025.9 | 77.9 | 14.8 | 0 | 0 | 0 | 0 | 0 | 0 | 12 |
| 13 | 19.7 | 10.2 | 7.8 | 12.5 | 8.1 | 0.0 | SW | 5.1 | 25 | 6 | 1020.5 | 80.1 | 14.0 | 0 | 0 | 0 | 0 | 0 | 0 | 13 |
| 14 | 15.5 | 6.0 | 1.5 | 12.7 | 8.5 | 3.9 | W | 3.4 | 20 | 1 | 1020.5 | 72.1 | 10.4 | 0 | 0 | 0 | 0 | 0 | 0 | 14 |
| 15 | 12.3 | 5.5 | 4.5 | 12.5 | 5.5 | 3.6 | W | 7.5 | 33 | 4 | 1005.1 | 79.4 | 8.3 | 0 | 0 | 0 | 0 | 1 | 1 | 15 |
| 16 | 13.4 | 5.0 | 2.5 | 11.8 | 4.7 | 0.0 | NW | 5.4 | 23 | 8 | 1011.9 | 80.5 | 8.3 | 0 | 0 | 0 | 0 | 0 | 0 | 16 |
| 17 | 12.1 | 3.4 | -1.3 | 11.4 | 6.1 | 1.7 | NW | 4.9 | 24 | 4 | 1014.9 | 79.7 | 6.9 | 0 | 0 | 0 | 0 | 0 | 0 | 17 |
| 18 | 13.5 | 3.4 | 0.0 | 11.0 | 7.2 | 4.7 | NW | 4.1 | 22 | 2 | 1020.3 | 80.5 | 8.2 | 0 | 0 | 0 | 0 | 0 | 0 | 18 |
| 19 | 14.4 | 8.0 | 7.0 | 11.5 | 2.0 | 2.7 | NW | 5.0 | 25 | 7 | 1017.2 | 80.9 | 9.4 | 0 | 0 | 0 | 0 | 0 | 0 | 19 |
| 20 | 10.9 | 2.9 | -0.8 | 11.3 | 4.8 | 0.0 | N | 4.3 | 19 | 4 | 1027.8 | 76.1 | 6.8 | 0 | 0 | 0 | 0 | 0 | 0 | 20 |
| 21 | 12.0 | 3.5 | 0.9 | 11.1 | 8.5 | TR | N | 4.7 | 20 | 3 | 1030.1 | 76.5 | 6.9 | 0 | 0 | 0 | 0 | 0 | 0 | 21 |
| 22 | 9.4 | 3.3 | -0.8 | 10.9 | 0.1 | 1.5 | NW | 1.8 | 11 | 8 | 1027.7 | 85.0 | 6.5 | 0 | 0 | 0 | 0 | 0 | 0 | 22 |
| 23 | 11.3 | 5.6 | 5.4 | 11.0 | 0.7 | 0.1 | NW | 4.0 | 22 | 7 | 1022.1 | 85.8 | 7.3 | 0 | 0 | 0 | 0 | 0 | 0 | 23 |
| 24 | 11.0 | 3.5 | -2.5 | 11.1 | 3.2 | TR | NW | 4.1 | 18 | 2 | 1015.6 | 77.0 | 6.5 | 0 | 0 | 0 | 0 | 0 | 0 | 24 |
| 25 | 12.5 | 1.2 | -3.3 | 10.7 | 2.6 | 0.0 | W | 2.4 | 16 | 1 | 1003.7 | 81.0 | 6.4 | 0 | 0 | 0 | 0 | 0 | 0 | 25 |
| 26 | 12.4 | -1.9 | -5.7 | 10.5 | 8.6 | TR | N | 2.1 | 12 | 5 | 1003.6 | 81.9 | 6.3 | 0 | 0 | 0 | 0 | 0 | 0 | 26 |
| 27 | 10.7 | 4.0 | 2.2 | 10.7 | 0.1 | 26.9 | E | 3.2 | 18 | 8 | 1003.6 | 89.9 | 7.1 | 0 | 0 | 0 | 0 | 0 | 0 | 27 |
| 28 | 13.1 | 6.3 | 6.0 | 10.5 | 0.6 | 0.3 | NW | 5.2 | 22 | 8 | 1003.7 | 89.9 | 7.9 | 0 | 0 | 0 | 0 | 0 | 0 | 28 |
| 29 | 16.8 | 4.0 | 0.9 | 10.5 | 10.0 | 0.0 | S | 4.4 | 27 | 5 | 1013.2 | 75.1 | 10.7 | 0 | 0 | 0 | 0 | 0 | 0 | 29 |
| 30 | 19.6 | 4.8 | -0.1 | 10.9 | 11.2 | 0.0 | SE | 3.5 | 22 | 1 | 1010.3 | 77.1 | 13.0 | 0 | 0 | 0 | 0 | 0 | 0 | 30 |
| Total/Mean | 14.8 | 6.3 | 3.7 | 11.3 | 141.8 | 62.3 | X | 4.8 | X | 5.1 | 1011.8 | 81.1 | 10.0 | 0 | 0 | 0 | 0 | 1 | 1 | Total/Mean |
| *Diff./% | +0.2 | +1.3 | 86% | 155% | *Diff./% | |||||||||||||||
| Date | Max. Temp. (°C) 09/09h | Min. Temp. (°C) 09/09h | Grass Min. Temp. (°C) 21/09h | Earth (30cms) Temp. (°C) 09h | Sun (Hours) 00/00h | R'fall (MM) 09/09h | Wind Dir'n 09h | Mean Wind Speed (MPH) 00/00h | Max. Gust Speed (MPH) 00/00h | Cloud Cover (Oktas) 09h | Mean MSL Air Pressure (mB) 00/00h | Mean Rel. Humd. (%) 00/00h | Mean Temp. (°C) 00/00h | Fog (vis. <1000m @ 09h) | Fog (vis. <200m @ 09h) | Snow or Rain and Snow 00/00h | Snow Lying @ 09h (>50% cover) | Hail 00/00h | Thunder 00/00h | Date |
Differences from average:
Differences from average shown in red (+), blue (-) and green (0). Reference periods used are as follows: Temperature 30 Years 1991/2020; rainfall 30 Years 1991/2020; sunshine 30 Years 1991/2020.
(*Note: Since Little Paxton (TN) Weather Station does not have a long term record for comparison purposes, the differences from average quoted here are based on the 30 Year (1991/2020) composite means from this station (2013/2020) and another station (1991/2012) in the Great Ouse catchment. Due to this limitation the differences from average are given as a guide only and do not form part of the official data for this weather station. The differences from average quoted during the course of the month relate to the cumulative daily averages up to the date of the last observation, not the averages for the month as a whole).
Additional Data:
Air Frost Duration 3.1 hours
Graphs and Charts:
Click on the following links to view this month's graphs and charts .......
1. Daily Maximum, Minimum & Grass Minimum Temperatures 2. Daily Earth (30 cms Depth) Temperature @ 0900 GMT 3. Daily Rainfall 4. Daily Sunshine
5. Daily Maximum Gust & Mean Wind Speed 6. Daily Wind Direction @ 0900 GMT 7. Daily Mean MSL Air Pressure 8. Daily Mean Relative Humidity
9. Thermograph 10. Barograph 11. Hygrograph 12. Anemograph 13. Wind Direction 14. Rainfall Intensity & Duration
|
|
|
|
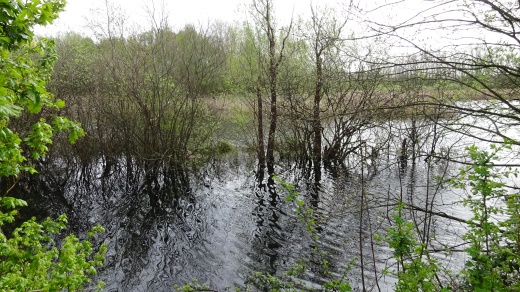
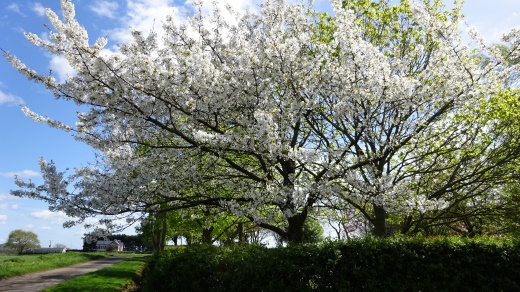
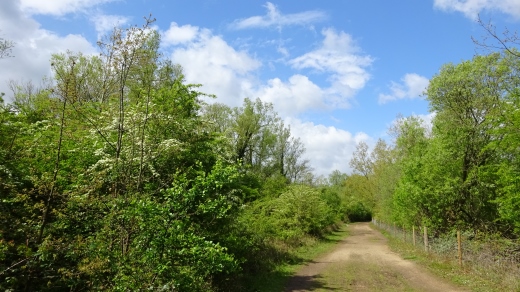
| Flooded peninsula, Hayling Lake, Little Paxton 8th April 2024 | Ford End Road, Little Paxton 14th April 2024 | Heron Trail, Paxton Pits Nature Reserve 25th April 2024 |
Return to Little Paxton (TN) Weather Station home page
(This page last updated 9th May 2024 1938 GMT)